It’s very important to understand how the market works regarding advanced investing. Hence, the Footprint Chart is a tool that gives you a detailed look at how the market is changing. When used in the NinjaTrader platform, it’s a great tool for traders who want to figure out order flow and number trends.
What Is Exactly NinjaTrader Footprint Chart?
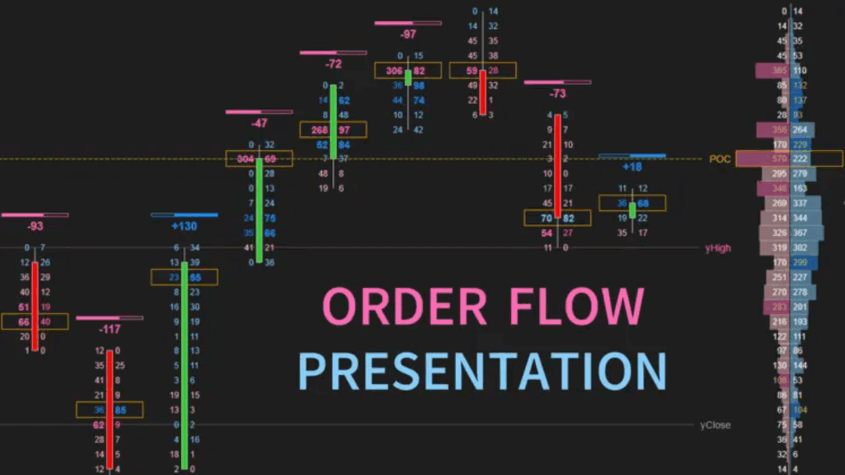
NinjaTrader users sometimes call this type of chart a Volumetric Bar Chart. It shows how much trading happens at each price level within a bar. This includes things like the bid/ask volume, the delta (the difference between the pressure to buy and sell), and variations in the volume. Further, the charts show traders the factors that drive prices and the extent and direction of market changes.
Why Should You Use NinjaTrader Footprint Chart?
Market understanding becomes easier thanks to the NinjaTrader footprint chart, which shows how orders and volume are distributed at different price points. This tool helps traders gain a deeper understanding of market emotion and detect early trends, which drives them to make better trading choices.
· Improved Market Understanding
The Footprint chart shows both bid and ask volume distributions at price levels, enabling traders to see how market participants operate. Because the system shows real-time supply and demand information, entry and exit decisions become more effective.
· Identifying Buying and Selling Pressure
Market control at particular price levels becomes visible through Footprint charts which display the sizes between buyer and seller orders. The data presents short-term trend reversal signals and confirms current market strength.
· Improved Trade Timing
Footprint charts create simpler entry and exit point identification because traders can spot actual volume rise or decrease points. Determination accuracy for intraday trades increases when this approach is used since it eliminates guesswork.
· Better Risk Management
The volume distribution throughout price levels shows traders where support and resistance zones will most likely occur. Identifying zones enables traders to set effective stop losses and targets to preserve capital and generate larger profits.
· Confirmation of Breakouts
Volume information in the NinjaTrader footprint chart helps traders distinguish the authenticity of breakouts from false signals. Traders become more confident when a price level experiences high transaction volume during its breakout because the move demonstrates a stronger chance of durability.
Tips to Use Footprint Chart on NinjaTrader Effectively
Listed below are some tips for using a footprint chart on NinjaTrader effectively:
- Pay attention to Delta Analysis: Keep an eye on the different numbers to see whether buyers or sellers are in charge.
- Check Out for Volume Clusters: Find places where much trading is happening. This could mean a lot of interest or a turning point.
- Combine with Other Tools: For a more complete look, use other measures like VWAP or Market Profile.
- Get Updates: Read tools and lessons regularly to stay current on new features and best practices.
Conclusion
The NinjaTrader footprint chart is a great tool for traders wanting to learn more about the market. It helps traders make better choices and improve their trading methods by showing them precise order flow and volume data. Adopting this advanced indicator can greatly improve your trade skills and results.
Find Out How Climate and Soil Affect Your House Stumps and When You Should Replace Them
Have you come across a sticky door or a dip in the floor when the weather is hot? Many Aus…


Perfect Ideas for Flowers Delivery in Dubai
Surprise your loved ones with flowers. Services like flowers delivery in Dubai can turn …


